Reverse Engineering

Understand x86_64 Assembly
Reverse engineering is the fundamental skill underpinning all exploit development and bug hunting. This makes it the fundamental task used to attack and defend any and all systems.
When you think of reverse engineering, do not solely associate it with breaking C programs. Reverse engineering encompasses not only software analysis, but also systems analysis, protocol analysis, and hardware analysis.
Examples:
If you want to remotely control a Honda Civic manufactured after 2016, you need to find a remote exploit. This means that you need to reverse engineer multiple systems within the car.
The cellular data hotspot used for in-vehicle WiFi is run directly in the kernel that controls the entire vehicle. Considering that this is a networked device running in the kernel, it is a good candidate for intial access to completely control the car.
As you continue reverse engineering the car, you will begin to understand how Controller Area Network (CAN) works. It operates like a multicast protocol in that it sends all transmissions everywhere in the system. Rogue CAN devices can exploit this and interupt/intercept/change communication on the wire. In fact, US DHS has recently reported on rogue CAN devices: US-CERT ICS Alert 19-211-01
Considerations:
When you engage in reverse engineering, exploit development, and bug hunting before a threat actor gets the chance, you have a significant advantage. By identifying and addressing potential vulnerabilities early, you can embed mitigations directly into the system from the start, rather than retrofitting them as an afterthought.
For example, a proactive systems engineer focused on security would avoid running a cellular hotspot directly in the kernel. Instead, they would keep it as isolated as possible to minimize risk. Similarly, to prevent unauthorized access through a rogue CAN (Controller Area Network) device, it’s crucial to ensure that CAN wires are physically protected. They should only be accessible under controlled maintenance conditions that are challenging to circumvent. By integrating preventive measures from the outset, you strengthen the system’s overall security posture and reduce the risk of exploitation.
Why we teach binary reverse engineering:
Reverse engineering compiled C programs is an accessible and cost-effective way to train, offering practical insights that are directly applicable to active missions. While it’s not a universal solution, the techniques and methodologies used in this process are consistent with those in all reverse engineering tasks. This means that the skills you develop are easily transferable to various reverse engineering scenarios, regardless of changes in technology such as hardware, protocols, or programming languages.
CPU DIE Explanation and Intro
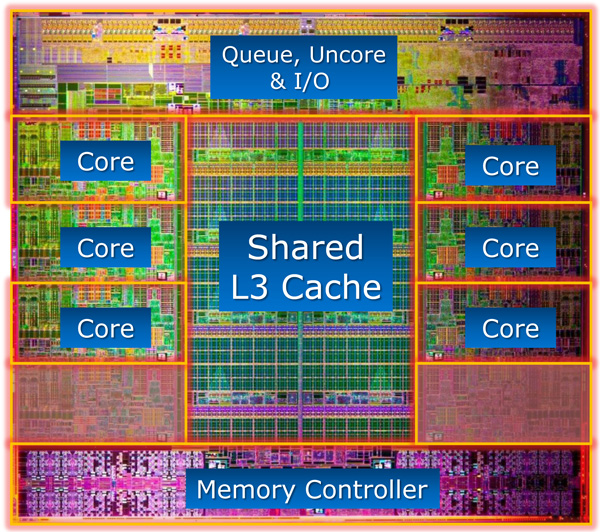
Utilize labeled cpu die to explain what each part is and what is contained in each component. CPU die diagram can be found here Each core contains all the transistors that are used to store values for the registers you are about to discuss. Each core also contains an l1 and l2 cache. L3 caches are shared amongst the cores. Caches are the fastest place to store data during operations. L1 is the closest, and therefore fastest to access, but is also the smallest. L2 is slightly larger and slower than l1. L3 shared caches are the largest and slowest to access. Memory is slower than caches, but substantially larger. The memory controller should be labeled on the diagram. Refer back to this diagram as necessary. Some students require multiple explanations as to "where" the registers are located and how they are doing their thing.
Programs in Memory
Stack - A section of memory reserved for temporary data storage, managed by the system to support program execution.
When a program is run, it is loaded into memory, which is organized into different regions: data, code, stack, and heap. The stack is a specific area that grows from high to low memory, moving from user space towards kernel space.
The stack operates on a last-in, first-out (LIFO) principle. This means that the most recently added item is the first to be removed. Imagine the stack as a stack of blocks where each block represents a stack frame. To add a block, you place it on top of the stack; to remove a block, you take the one on top.
Each stack frame contains data relevant to the current function or procedure. The size of these frames depends on the CPU architecture. For a 32-bit x86 processor, stack frames are 32 bits in size, while for a 64-bit x86 processor, they are 64 bits.
Understand data sizes
When looking at a disassembled program, you may encounter different sized data references. Below are the most common data sizes that may be seen.
Bit - smallest unit in computing. A single 0 or 1
Nibble - 4 bits/half an octet
Byte - 8 binary bits
Word - 16 bits
DWord - 32 bits
QWord - 64 bits
Understand x86_64 registers
General Register - A versatile register used to store data or memory addresses, which can be utilized by both programmers and the system.
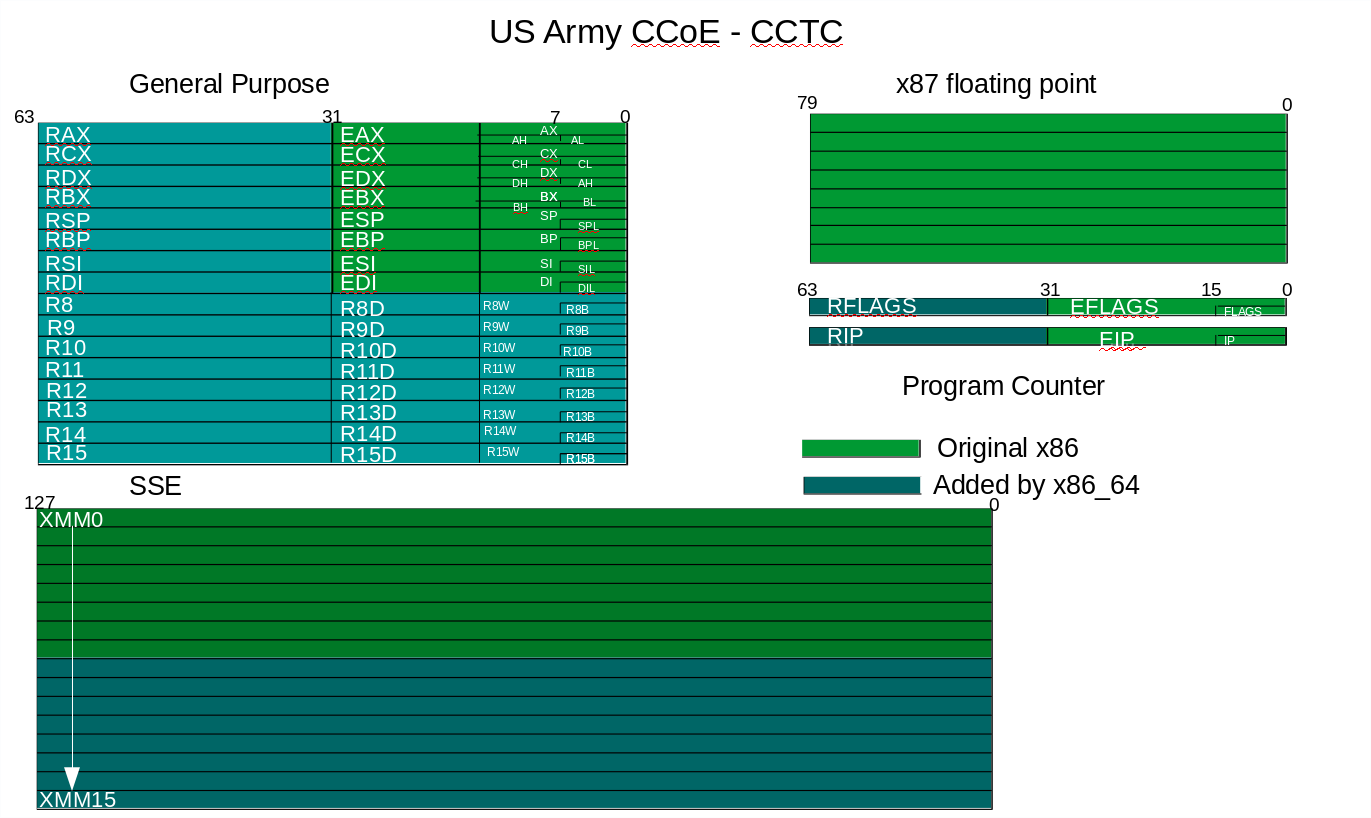
In modern 64-bit x86 architectures, there are 16 general-purpose registers, each 64 bits in size. These registers can be accessed in various ways depending on the level of granularity needed. For instance, consider the %rbx register. The full 64-bit register is accessed using %rbx. However, it can also be accessed in smaller segments: the lower 32 bits are accessed using %ebx, and within %ebx, you can further access the lower 16 bits using %bx and the lowest 8 bits using %bl.
Originally, x86 architecture was 32-bit and featured eight general-purpose registers: EAX, ECX, EDX, EBX, ESP, EBP, ESI, and EDI. Each of these could be accessed in 32-bit, 16-bit, and 8-bit segments, but with the transition to 64-bit architecture, the register set expanded and adapted to support the increased bit-width. Reference this diagram for clarification: Registers-Diagram
| 64-bit register | lower 32 bits | lower 16 bits | lower 8 bits | Description |
|---|---|---|---|---|
| rax | eax | ax | al | |
| rbx | ebx | bx | bl | |
| rcx | ecx | cx | cl | |
| rdx | edx | dx | dl | |
| rsi | esi | si | sil | |
| rdi | edi | di | dil | |
| rbp | ebp | bp | bpl | base pointer; start of stack |
| rsp | esp | sp | spl | stack pointer; current spot on stack |
| r8 | r8d | r8w | r8b | |
| r9 | r9d | r9w | r9b | |
| r10 | r10d | r10w | r10b | |
| r11 | r11d | r11w | r11b | |
| r12 | r12d | r12w | r12b | |
| r13 | r13d | r13w | r13b | |
| r14 | r14d | r14w | r14b | |
| r15 | r15d | r15w | r15b |
%raxis the primary return register in x86-64 architecture. When a function completes and returns a value, %rax is the register used to store this return value. If the function returns multiple values, %rax is typically used for the first value, while additional values may be returned in other registers or locations as specified by the calling convention.
Question
What would be the first return register of a 32 bit x86 processor? %eax because it is the lower 32 bits of the %rax register.
%rbpis the base pointer register, used to keep track of the base of the stack frame for the current function. It provides a stable reference point for accessing function parameters and local variables within the stack frame. For instance, you might encounter function arguments referenced with an offset relative to %rbp, such as ivar_8 [%rbp-0x8]. This notation indicates the memory address where the argument data is stored, with the offset specifying its position relative to the base pointer.
| Local Variable | ← [%rbp+offset] |
|---|---|
| Return Address | ← [%rbp] |
| ----------------------- | ------------------- |
| Function Parameter 1 | ← [%rbp-0x8] |
| ----------------------- | ------------------- |
| Function Parameter 2 | ← [%rbp-0x10] |
| ----------------------- | ------------------- |
Base Pointer (%rbp): Points to the start of a stack frame.
Offsets: Indicate the position of different items relative to %rbp.
By using %rbp as a reference, the program can easily locate function parameters and local variables within the stack frame, making it easier to manage and access this data efficiently.
Question
What is the base pointer register of a 32 bit x86 processor? %ebp because it is the lower 32 bits of the %rbp register.
-
%rsp: In x86-64 architecture, %rsp is the stack pointer register that indicates the top of the stack. It adjusts as values are pushed onto or popped off the stack. In the 32-bit x86 architecture, the equivalent register is %esp, which performs the same function but in a 32-bit context. -
All registers can technically be written to as general purpose registers, but you will not see anything outside of standard convention from an industry-standard disassembler.
-
The call saved (non-volatile) registers are
%rbx,%rsp,%rbp,%r12-%r15. All other registers are volatile. These are registers that will maintain their values even when a function is called or exits.
There is one instruction pointer register that points to the memory offset of the next instruction in the code segment:
Control Register - A type of processor register that governs or modifies the behavior of the CPU. Control Registers are essential for managing various aspects of the processor’s operation, such as interrupt handling, switching addressing modes, managing paging, and controlling co-processors.
In x86-64 architecture, there are 16 control registers, labeled %CR0 through %CR15. Among these, only %CR0 is directly accessible for reading and writing by user code. The other control registers are used internally by the CPU or by the operating system for specialized tasks, often related to kernel development and system-level operations.
Flags Register - This register holds the current state of the processor, reflecting the outcomes of various operations and influencing subsequent instructions.
In the x86 architecture:
FLAGS is the 16-bit flags register used in 16-bit mode. EFLAGS is the 32-bit flags register used in 32-bit mode. RFLAGS is the 64-bit flags register used in 64-bit mode. The wider flag registers are backward compatible with the narrower versions, meaning that the additional bits in the larger registers extend the functionality while maintaining compatibility.
%RFLAGS is the 64-bit flags register used in x86-64 architecture. Flags within the register are updated based on the results of arithmetic and logical operations. Key flags to be aware of include:
Carry Flag (CF): Indicates an overflow in arithmetic operations. Zero Flag (ZF): Set if the result of an operation is zero. Sign Flag (SF): Reflects the sign of the result of an operation (positive or negative). These flags are crucial for conditional instructions, such as JE (Jump if Equal), which relies on the state of these flags to determine the control flow of a program.
Its bits are labeled as:
| Bit | Label | Flag Name | Description |
|---|---|---|---|
| 0 | CF | Carry Flag | Set by arithmetic instructions that generate either a carry or borrow. |
| 1 | 1 | Reserved | |
| 2 | PF | Parity Flag | Set by most CPU instructions if the least significant bit of the destination operand contains an even number of 1's. |
| 3 | 0 | Reserved | |
| 4 | AF | Auxiliary Carry Flag | Set when a CPU instruction generates a carry to or borrow from the low-order 4 bits of an operand. This flag is used for binary coded decimal (BCD) arithmetic. |
| 5 | 0 | Reserved | |
| 6 | ZF | Zero Flag | Set by most instructions if the result of an operation is binary zero. |
| 7 | SF | Sign Flag | Most operations set this bit the same as the most significant bit of the result. 0=positive, 1=negative. |
| 8 | TF | Trap Flag | When set by a program, the processor generates a single-step interrupt after each instruction. |
| 9 | IF | Interrupt Enable Flag | When set, external interrupts are recognized by the processor on the INTR pin. When set, interrupts are recognized and acted on as they are received. |
| 10 | DF | Direction Flag | Used for string processing. When set to 1, string operations process down from high addresses to low addresses. If cleared, string operations process up from low to high addresses. Set and cleared using STD and CLD instructions. |
| 11 | OF | Overflow Flag | Set by most arithmetic instructions indicating the result was too large to fit in the destination. |
| 12/13 | IOPL | I/O Privilege Level | Used in protected mode to generate 4 levels of security. |
Note
Certain instructions like CMP set these bits, and other instructions read them to determine certain actions like JE. The zero flag and sign flag are particularly important.
There are also sixteen 128 bit SSE registers used for floating point and double operations.
They are %xmm0 - %xmm15
- SSE=Streaming SIMD Extension
- SIMD=Single Instruction, Multiple Data: Typical applications are digital signal processing and graphics processing.
Registers Diagram
Utilise provided registers diagram to visually explain how certain registers can be broken down into different components.
Understand standard x86_64 Intel instructions
For the most part, assembly instructions follow the following format: CMD DST,SRC It is always the destination that is updated when performing these actions. The source does not change.
MOV: move to destination from source
PUSH: push source onto stack. This is a special form of MOV where the destination is always the top of the stack.
POP: Pop top of stack to destination. This is a special form of MOV where the source is always the top of the stack.
INC: Increment source by 1
DEC: Decrement source by 1
ADD: Add source to destination
SUB: Subtract source from destination
CMP: Compare 2 values by subtracting them and setting the %RFLAGS register. ZeroFlag set means they are the same. SignFlag set means the result of the comparison is the first register being less than the second register.
JMP: Jump to specified location
JLE: Jump if less than or equal
JE: Jump if equal
Understand the x86_64 stack
Tip
Explained at the begining of lecture with the diagrams
DEMO: x64 ASM flow
Student Practice - Stack Practice
Tip
This activity should be done following the instructions below. It has proven to shed light on what students don't understand, and allows them to ask good questions that they didn't know they had.
- Download PDF from CTFd
- Complete the first 3 pages with the students so that they understand how to fill it in then give them 20-40 mins to complete it individually.
- Review the activity as a class, ensuring that many students participate and answer each page.
- Students will ask many questions, and it is important to take the time at this phase to answer them thoroughly.
- GDB, or another program, can be used as a visual aid with this activity during review, but ensure that you are not yet teaching the students how to use a tool.
Follow C Source Code
Python Programming
Determining Binary Behavior
Recieve or discover object to be analyzed
This is the phase where reverse engineering and analysis begins. You have recieved the object (software, hardware, signals) to be reverse engineered. This could happen in any number of ways. Examples of acquisition:
- An object, or software for our case, is sent to your team by another group.
- Your team may have have found malicious software in traffic.
- A piece of enemy hardware may have been captured.
- You have captured traffic of some kind with unique protocols that need to be analyzed and reverse engineered.
- Think of any other methods of acquisition of software or hardware.
Determine reason for analysis
This is where you determine, or re-evaluate, your intent behind analyzing the object. Are we analyzing with the intent of determining if it's malicious? Are we intent upon retooling potential malware for our own purposes? Are we attempting to create mitigations and signatures? Are we attempting to find vulnerabilities in an effort to create exploits for later use? Are we attempting to find vulnerabilities in an effort to create mitigations/patches to harden our networks?
These questions will help an analyst determine what they need to do to accomplish their goals and will ultimately change what they document, focus on, and look for.
Static analysis
Initial static analysis of a binary gives an analyst, or team of analysts, several clues as to what the binary is designed to do and how it really works.
-
Determine file type - Is it an executable? What environment is it designed to run in? (OS,cpu architecture, etc)
- This can be accomplished in many ways:
- Open executable file in a raw text editor and view header. MZ is the header for a portable executable which is generally associated with Windows executables. ELF is the header for an Executable and Linkable Format file which is generally referred to as a Linux executable.
- Run the "file" command on the binary on a Linux box.
- Import the file into Ghidra or Ida64. These programs will attemp to identify the executable as part of the import process.
- This can be accomplished in many ways:
-
Determine if file is packed/compressed (UPX)
- Packing is outside of the scope of this class, but it is a compression technique that allows for moderate obfuscation.
-
Find plain text ascii and unicode strings
- The Linux command
stringswill print them to standard out. - For Windows there is a Sysinternals Strings tool as well
- IDA free and Ghidra may be configured to find unicode strings and ascii strings that CFF Explorer may not.
- The Linux command
-
View sections of the executable to find potential obfuscation.
- Using a tool outside the scope of this class (CFF Explorer) open the "section headers" tab on the left menu. Look for anything out of the ordinary. You would expect to see .txt, .rdata, .data, .rsrc, and .relo- Anything else would point to obfuscation and may even be name with the type of obfuscation (i.e. AESeal)
-
View imports/exports to get a hint of functionality/calls (is it importing a library that can open a socket, etc?).
- Optionaly utilize CFF Explorer and view contents of the "imports" and "exports" tabs on the left menu.
- The imports tab can give hints as to what functionality the executable is utilizing. If you see a library being called that deals with networking or sockets, then you can dig into that and view what functions from it are being referenced. This would indicate that the binary is utilizing sockets either for IPC or some kind of networked operation which may mean that it is calling back to the malicious author or many other things.
- The exports tab will contain things that the binary is making available to other things on the system. This is common for things like malicious DLLs.
-
View resources to find embedded objects
- Possibly utilize CFF Explorer to view the "Resource Editor" tab on the left menu. This will allow analysts to dig into the many resources of the binary. The resources can be extracted through CFF Explorer if they seem interesting.
A reference for using CFF Explorer to accompish some of these goals is this article on basic static analysis.
Behavioral Analysis
Behavioral analysis of software (or anything) is generally considered the most basic form of analysis. Simply put, the thing being reverse engineered is interacted with in a variety of ways and allowed to behave as normal. Reactions are recorded with various utilities and analyzed. Because of the ease and speed of this form of analysis, it is generally completed by less experienced analysts as a "triage phase". Behavioral Analysis is the fastest way to gain insight into how a binary works.
Tip
The following steps are only to be discussed as they are how you would perform behavioral analysis in a real environment, but are not conducive to our environment.
- Take a snapshot of the analysis environment - Important! Taking a snapshot on an OpenStack VM takes a substantial amount of time.
- Take a snapshot of critical configurations of the analysis environment. (Things like the registry, important directories, etc)
- Launch realtime analysis tools (Things like procmon and fakenet)
- Execute and interact with the object/binary while taking note of observations.
- Stop the binary and view how it affected critical configurations (registry, files, etc) by comparing to previous snapshots
- Analyze results of realtime analysis tools (did fakenet catch network calls, did procmon show it writing to a file, etc)
To demo behavoral analysis:
- Open the binary that you have been analyzing.
- Take note of what happens. Save the strings you see on the terminal to a text document. Ensure students take note that the program has "printed" these strings to the terminal.
- Enter some gibberish and record what happens. Save strings to your notes. These "artifacts" will be used later in analysis.
- Take note that the program prints out a failure statement and then "Sleeps" for 5 seconds. This failure statement and sleep behavior can be used later in analysis.
- Repeat step 1-4, but incorporate sysinternal tools such as procmon. Set the filter to for only the process that you're analyzing. Inform students that you are looking for "writing" to registry keys, creating/reading files, and potential process forking.
Dynamic Analysis
Dynamic analysis for software anlaysis usually refers to debugging. During this type of analysis, a debugger is attached to a process, or vice-versa, and keeps tracks of all of the memory, registers, and other important components of a running piece of software. Debuggers do not fully unpack or disassemble a piece of software and relies solely on how a binary is being interacted with.
Dynamic analysis is similar to behavioral, except the analyst is attaching the process to a debugger. Debuggers are very effective when dealing with encryption or obfuscation. This is because the binary will potentially deobfuscate itself and reveal its obfuscation operations or encryption key.
Tip
The following steps are only to be discussed as we are not introducing debuggers until exploit development. Students may be given resources and video demos on how to use debuggers like Immunity if they wish to use them during this section of the course. However, instruction on debuggers should not yet occur.
- Execute binary in a debugger
- Step through binary, setting breakpoints as appropriate
- Continuously rerun the binary and edit its parameters through the debugger, as you learn more about how it works
- Document all observations and modifications
Disassembly
An analyst may be required to disassemble a binary to learn more about how it runs.
-
Disassemble binary in Ghidra
- Open Ghidra, start a new project, and import the binary that is being analyzed (demo.exe or other). Once imported, the splash screen for the binary should include information about its file type, cpu architecture, and several other things. This should match what you have found so far (x86, 32 bit, portable execuatble )
- Run the code analyzer by clicking on the dragon icon. If your binary does not get loaded into the code analyzer, import it by going to "File"->"Import" or "Open".
- When asked, accept the default options and "analyze" the binary. This automatic analysis finds lots of things that may otherwise not be seen by the disassembler.
-
Use notes to find artifacts within the disassembly
- Ask students what artifacts you have already found to help direct your analysis of the disassembled binary. They should respond with some of strings printed to the terminal. Start with one of those strings.
- Go to View -> Search For -> Strings. Edit the options to your liking (default works fine). All the found strings will be displayed. The bottom of this window contains a search bar. Search for your chosen string artifact. Clicking on the string artifact will take you to the data section of the disassembly. You will need to find the "xref" to the string and click on that. This "xref" will take you to the code portion of the disassembly that it is calling.
-
Find a good spot to work from within the binary. Then quickly browse from the top to the bottom of the disassembly to view the overall flow of the disassembly
- You have already established where to work from. If you chose a failure message or the initial prompt string, it will put you in the "main" function where you will see the initial printf statement ("Enter key: ") and failure message. Right above the failure, and now visible success, message will be the conditions that have to be met to be successful.
-
Work your way from the bottom to the top - if there are two outcomes choose the one you want to end at, then work your way up from there to determine what needs to happen for the program to flow to the desired outcome. Rename variables and functions as appropriate when quickly scanning top to bottom of the disassembly.
- Once you have found the success message, work upwards. There will be a condition that has be met. This will be a comparison between the return code of the most recent function and some value. This value will be in hex but can be converted by right-clicking on it in the disassembly and converting to unsigned int.
- Take note of the value you need to be successful then go into the most recent function to determine under what conditions it will return the value you need for the success message. If you are using demo.exe, you will need to look several functions deep, but at the end of the day, the binary is taking the user input, converting it to integer with atoi(), and subtracting that value from 123. If the difference between userinput and 123 is zero, you will return a success statement.
- Test out what you have just found by running the binary, entering an acceptable key (123 for demo.exe), and showing the students a success message.
A Professional Shop
- professional reverse engineering shop will follow something similar to this exact process. The only difference is that there will be different individuals or teams assigned to different tasks.
A general overview of a professional shop workflow:
- Initial analysis will be performed by "triage analysts". This phase will involve the first several steps of analysis after the shop recieves the binary and their tasking. Shop leadership will have determined the end goal for the analysis. Triage analysts will then take the binary and the goal and perform initial static and behavioral analysis. They will document everything they find and submit their reports/evidence/findings back to the team. Their report may include things like general functionality of the program, a determination of if the binary is malicious, potential IP addresses that the binary calls back to, and potential additional functionality they may not have been able to confirm.
- As appropriate, mid-level analysts will take the findings of the triage analysts, and expand upon them. They will use all the evidence and artifacts found by triage analysts to speed up their dynamic analysis and disassembly. Mid-level analysts will generally verify all findings from the triage analysts, and perform more detailed analysis. This step in a professional shop confirms or refutes the findings of the triage analysts, document additional functionalities, and produces some signatures to detect the binary behaviors on the wire or on a host machine.
- When requested or necessary, "in-depth analysts" or "senior analysts" will perfrom extremely detailed analysis of the binary. They will use and confirm the previous analysts' findings, and greatly expand the understanding of the binary. This phase will generally produce advanced signatures, extremely detailed report on the exact functionality of the binary, and new tools/scripts to be used by analysts for future analysis. In-depth analysts will also regularly work with developers to retool malware, patch vulnerabilities in software, and create exploits for operational use.
Discussion
What is encryption?
How do you use encryption day-to-day?
Why might software want to encrypt portions of itself?
Defeating binary encryption
How malware and executables use encryption
Payload encryption: A portion within the binary is encrypted then injected into another process or dropped as an executable payload onto the system.
Section encryption: Commonly referred to as a crtyper. These encrypt data or code sections of an executable.
Binary packing: The binary is compressed. Can generally be unpacked with open source tools.
Regardless, the binary must go through this cycle: decrypt/unpack, drop/run payload, cleanup, cease execution. When analyzing the binary, this should be easy to find/see either in disassembly or a debugger.